Data Visualization and Presentation


See the Story Behind Your Data
At KS&V Solutions, we believe that data is most powerful when it's easy to understand and act upon. That's why our Data Visualization and Presentation service is designed to turn complex information into clear, compelling visual stories.
Why It Matters?
Raw data alone doesn't solve problems — understanding it does. Many businesses struggle to identify the root causes of their challenges due to overwhelming or unorganized data. Our visual approach changes that.
What We Do?
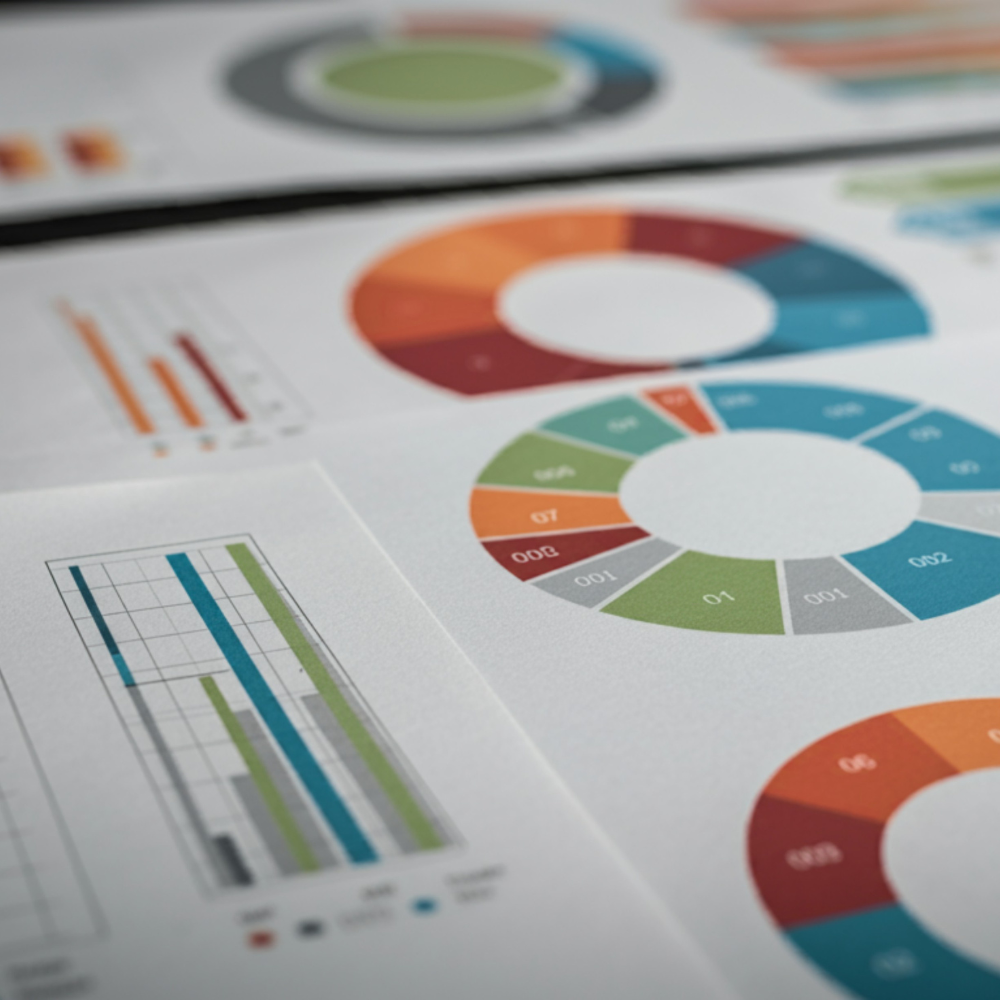
We present your collected data through intuitive charts, graphs, dashboards, and dynamic reports that are easy to interpret and act on. These visuals enable you to:
● Quickly identify problem areas
● Understand patterns and trends
● Make informed, strategic decisions
⚙️ How We Do It
Our expert team specializes in analyzing complex datasets and transforming them into interactive dashboards using top-tier tools like:
● Microsoft Power BI
● Microsoft Excel
These tools allow us to deliver real-time insights, dynamic filtering, and a complete picture of your business landscape.
✅ What You Get
● Clear storytelling from complex data
● Root cause analysis made visual and simple
● Holistic comparison of meaningful data
● Real-time, interactive dashboards
● Professional-grade reporting using trusted tools
Let’s Transform Your Data
Whether you're solving problems or spotting new opportunities, KS&V Solutions will turn your data into a roadmap for success — clear, actionable, and visually powerful.